 Preshing on Programming
When debugging multithreaded code, it’s not always easy to determine which codepath was taken. You can’t always reproduce the bug while stepping through the debugger, nor can you always sprinkle printfs throughout the code, as you might in a single-threaded program. There might be millions of events before the bug occurs, and printf can easily slow the application to a crawl, mask the bug, or create a spam fest in the output log.
One way of attacking such problems is to instrument the code so that events are logged to a circular buffer in memory. This is similar to adding printfs, except that only the most recent events are kept in the log, and the performance overhead can be made very low using lock-free techniques.
Here’s one possible implementation. I’ve written it specifically for Windows in 32-bit C++, but you could easily adapt the idea to other platforms. The header file contains the following:
#include <windows.h>
#include <intrin.h>

namespace Logger
{
    struct Event
    {
        DWORD tid;        // Thread ID
        const char* msg;  // Message string
        DWORD param;      // A parameter which can mean anything you want
    };

    static const int BUFFER_SIZE = 65536;   // Must be a power of 2
    extern Event g_events[BUFFER_SIZE];
    extern LONG g_pos;

    inline void Log(const char* msg, DWORD param)
    {
        // Get next event index
        LONG index = _InterlockedIncrement(&g_pos);
        // Write an event at this index
        Event* e = g_events + (index & (BUFFER_SIZE - 1));  // Wrap to buffer size
        e->tid = ((DWORD*) __readfsdword(24))[9];           // Get thread ID
        e->msg = msg;
        e->param = param;
    }
}

#define LOG(m, p) Logger::Log(m, p)
And you must place the following in a .cpp file.
namespace Logger
{
    Event g_events[BUFFER_SIZE];
    LONG g_pos = -1;
}
This is perhaps one of the simplest examples of lock-free programming which actually does something useful. There’s a single macro LOG, which writes to the log. It uses _InterlockedIncrement, an atomic operation which I’ve talked about in previous posts, for thread safety. There are no readers. You are meant to be the reader when you inspect the process in the debugger, such as when the program crashes, or when the bug is otherwise caught.
Using It to Debug My Previous Post
My previous post, Memory Reordering Caught In the Act, contains a sample program which demonstrates a specific type of memory reordering. There are two semaphores, beginSema1 and beginSema2, which are used to repeatedly kick off two worker threads.
While I was preparing the post, there was only a single beginSema shared by both threads. To verify that the experiment was valid, I added a makeshift assert to the worker threads. Here’s the Win32 version:
DWORD WINAPI thread1Func(LPVOID param)
{
    MersenneTwister random(1);
    for (;;)
    {
        WaitForSingleObject(beginSema, INFINITE);  // Wait for signal
        while (random.integer() % 8 != 0) {} // Random delay

        // ----- THE TRANSACTION! -----
        if (X != 0) DebugBreak();  // Makeshift assert
        X = 1;
        _ReadWriteBarrier();  // Prevent compiler reordering only
        r1 = Y;

        ReleaseSemaphore(endSema, 1, NULL);  // Notify transaction complete
    }
    return 0;  // Never returns
};
Surprisingly, this “assert” got hit, which means that X was not 0 at the start of the experiment, as expected. This puzzled me, since as I explained in that post, the semaphores are supposed to guarantee the initial values X = 0 and Y = 0 are completely propagated at this point.
I needed more visibility on what was going on, so I added the LOG macro in a few strategic places. Note that the integer parameter can be used to log any value you want. In the second LOG statement below, I use it to log the initial value of X. Similar changes were made in the other worker thread.
    for (;;)
    {
        LOG("wait", 0);
        WaitForSingleObject(beginSema, INFINITE);  // Wait for signal
        while (random.integer() % 8 != 0) {} // Random delay

        // ----- THE TRANSACTION! -----
        LOG("X ==", X);
        if (X != 0) DebugBreak();  // Makeshift assert
        X = 1;
        _ReadWriteBarrier();  // Prevent compiler reordering only
        r1 = Y;

        ReleaseSemaphore(endSema, 1, NULL);  // Notify transaction complete
    }
And in the main thread:
    for (int iterations = 1; ; iterations++)
    {
        // Reset X and Y
        LOG("reset vars", 0);
        X = 0;
        Y = 0;
        // Signal both threads
        ReleaseSemaphore(beginSema, 1, NULL);
        ReleaseSemaphore(beginSema, 1, NULL);
        // Wait for both threads
        WaitForSingleObject(endSema, INFINITE);
        WaitForSingleObject(endSema, INFINITE);
        // Check if there was a simultaneous reorder
        LOG("check vars", 0);
        if (r1 == 0 && r2 == 0)
        {
            detected++;
            printf("%d reorders detected after %d iterations\n", detected, iterations);
        }
    }
The next time the “assert” was hit, I checked the contents of the log simply by watching the expressions Logger::g_pos and Logger::g_events in the Watch window.
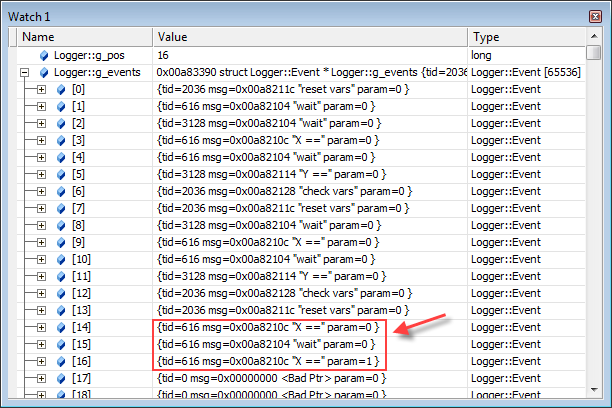
In this case, the assert was hit fairly quickly. Only 17 events were logged in total (0 - 16). The final three events made the problem obvious: a single worker thread had managed to iterate twice before the other thread got a chance to run. In other words, thread1 had stolen the extra semaphore count which was intended to kick off thread2! Splitting this semaphore into two separate semaphores fixed the bug.
This example was relatively simple, involving a small number of events. In some games I’ve worked on, we’ve used this kind of technique to track down more complex problems. It’s still possible for this technique to mask a bug; for example, when memory reordering is the issue. But even if so, that may tell you something about the problem.
Tips on Viewing the Log
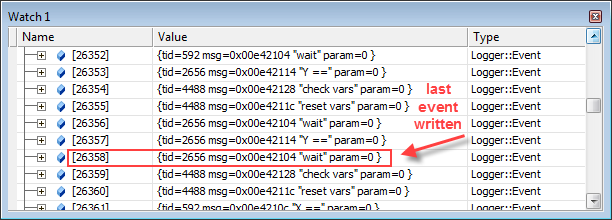
The g_events array is only big enough to hold the latest 65536 events. You can adjust this number to your liking, but at some point, the index counter g_pos will have to wrap around. For example, if g_pos has reached a value of 3630838, you can find the last log entry by taking this value modulo 65536. Using interactive Python:
>>> 3630838 % 65536
26358
When breaking, you may also find that “CXX0017: Error: symbol not found” is sometimes shown in the Watch window, as seen here:
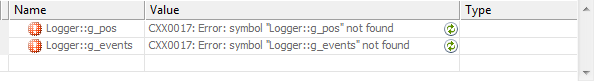
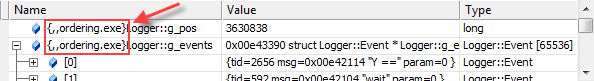
This usually means that the debugger’s current thread and stack frame context is inside an external DLL instead of your executable. You can often fix it by double-clicking a different stack frame in the Call Stack window and/or a different thread in the Threads window. If all else fails, you can always add the context operator to your Watch expression, explicitly telling the debugger which module to use to resolve these symbols:
One convenient detail about this implementation is that the event log is stored in a global array. This allows the log show up in crash dumps, via an automated crash reporting system for example, even when limited minidump flags are used.
What Makes This Lightweight?
In this implementation, I strived to make the LOG macro as non-intrusive as reasonably possible. Besides being lock-free, this is mainly achieved through copious use of compiler intrinsics, which avoid the overhead of DLL function calls for certain functions. For example, instead of calling InterlockedIncrement, which involves a call into kernel32.dll, I used the intrinsic function _InterlockedIncrement (with an underscore).
Similarly, instead of getting the current thread ID from GetCurrentThreadId, I used the compiler intrinsic __readfsdword to read the thread ID directly from the Thread Information Block (TIB), an undocumented but well-known data structure in Win32.
You may question whether such micro-optimizations are justified. However, after building several makeshift logging systems, usually to handle millions of events in high-performance, multi-threaded code, I’ve come to believe that the less intrusive you can make it, the better. As a result of these micro-optimizations, the LOG macro compiles down to a few machine instructions, all inlined, with no function calls, no branching and no blocking:
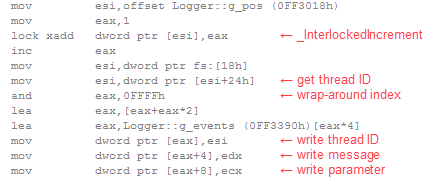
This technique is attractive because it is very easy to integrate. There are many ways you could adapt it, depending on your needs, especially if performance is less of a concern. You could add timestamps and stack traces. You could introduce a dedicated thread to spool the event log to disk, though this would require much more sophisticated synchronization than the single atomic operation used here.
After adding such features, the technique would begin to resemble Microsoft’s Event Tracing for Windows (ETW) framework, so if you’re willing to go that far, it might be interesting to look at ETW’s support for user-mode provider events instead.