 Preshing on Programming
In my post about lock contention, I gave some statistics for the memory allocator in a multithreaded game engine: 15000 calls per second coming from 3 threads, taking around 2% CPU. To collect those statistics, I wrote a small profiling module, which I’ll share here.
A profiling module is different from conventional profilers like xperf or VTune in that no third-party tools are required. You just drop the module into any C++ application, and the process collects and reports performance data by itself.
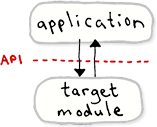 This particular profiling module is meant to act on one or more target modules in the application. A target module can be anything which exposes a well-defined API, such as a memory allocator. To make it work, you must insert a macro named
 API_PROFILER into every public function exposed by that API. Below, I’ve added it to dlmalloc, one of the functions in the Doug Lea Malloc API. The same macro should be added to dlrealloc, dlfree, and other public functions as well.
DEFINE_API_PROFILER(dlmalloc);

void* dlmalloc(size_t bytes)
{
    API_PROFILER(dlmalloc);

#if USE_LOCKS
    ensure_initialization();
#endif

    if (!PREACTION(gm))
    {
        void* mem;
        size_t nb;
        if (bytes <= MAX_SMALL_REQUEST)
        {
            ...
The macro takes a single argument, which is just an identifier for the target module being profiled. For this to be a valid identifier, you must place exactly one DEFINE_API_PROFILER macro at global scope, as seen above. You can also insert DECLARE_API_PROFILER anywhere at global scope, perhaps in a header file, in the same way that you’d forward declare a global variable or function.
When the application runs, each thread will automatically log performance statistics once per second, including the thread identifier (TID), time spent inside the target module, and the number of calls. Here, we see performance statistics across six different threads:
TID 0x13bc time spent in "dlmalloc": 7/1001 ms 0.7% 6481x
TID 0x1244 time spent in "dlmalloc": 6/1000 ms 0.6% 6166x
TID 0x198 time spent in "dlmalloc": 0/3072 ms 0.0% 2x
TID 0x11d0 time spent in "dlmalloc": 0/1113 ms 0.0% 6x
TID 0x12a4 time spent in "dlmalloc": 0/1000 ms 0.0% 20x
TID 0xc14 time spent in "dlmalloc": 4/1011 ms 0.4% 3243x
To identify each thread, simply break in the debugger and look for the TID in the Threads view.
Most of the profiling module is implemented in a single header file, as follows. For simplicity, I’ve only provided the Windows version, but you could easily port the code to other platforms.
#define ENABLE_API_PROFILER 1     // Comment this line to disable the profiler

#if ENABLE_API_PROFILER

//------------------------------------------------------------------
// A class for local variables created on the stack by the API_PROFILER macro:
//------------------------------------------------------------------
class APIProfiler
{
public:
    //------------------------------------------------------------------
    // A structure for each thread to store information about an API:
    //------------------------------------------------------------------
    struct ThreadInfo
    {
        INT64 lastReportTime;
        INT64 accumulator;   // total time spent in target module since the last report
        INT64 hitCount;      // number of times the target module was called since last report
        const char *name;    // the name of the target module
    };

private:
    INT64 m_start;
    ThreadInfo *m_threadInfo;

    static float s_ooFrequency;      // 1.0 divided by QueryPerformanceFrequency()
    static INT64 s_reportInterval;   // length of time between reports
    void Flush(INT64 end);

public:
    __forceinline APIProfiler(ThreadInfo *threadInfo)
    {
        LARGE_INTEGER start;
        QueryPerformanceCounter(&start);
        m_start = start.QuadPart;
        m_threadInfo = threadInfo;
    }

    __forceinline ~APIProfiler()
    {
        LARGE_INTEGER end;
        QueryPerformanceCounter(&end);
        m_threadInfo->accumulator += (end.QuadPart - m_start);
        m_threadInfo->hitCount++;
        if (end.QuadPart - m_threadInfo->lastReportTime > s_reportInterval)
            Flush(end.QuadPart);
    }
};

//----------------------
// Profiler is enabled
//----------------------
#define DECLARE_API_PROFILER(name) \
    extern __declspec(thread) APIProfiler::ThreadInfo __APIProfiler_##name;

#define DEFINE_API_PROFILER(name) \
    __declspec(thread) APIProfiler::ThreadInfo __APIProfiler_##name = { 0, 0, 0, #name };

#define TOKENPASTE2(x, y) x ## y
#define TOKENPASTE(x, y) TOKENPASTE2(x, y)
#define API_PROFILER(name) \
    APIProfiler TOKENPASTE(__APIProfiler_##name, __LINE__)(&__APIProfiler_##name)

#else

//----------------------
// Profiler is disabled
//----------------------
#define DECLARE_API_PROFILER(name)
#define DEFINE_API_PROFILER(name)
#define API_PROFILER(name)

#endif
The DEFINE_API_PROFILER macro defines a thread-local variable using the __declspec(thread) modifier. This gives each thread its own private data, independent of other threads, so the whole system works in a multithreaded environment with little performance penalty. In GCC, the equivalent storage class modifier would be __thread. The overhead for such storage is low, but on Windows, there’s one catch: you can’t use it across DLLs.
The API_PROFILER macro creates a C++ object on the stack, taking advantage of the constructor to signal the beginning and the destructor to signal the end of the section being measured. The macro uses a token-pasting trick, using the current line number, to create unique local variable names.
It’s important not to call this macro recursively. In other words, don’t insert API_PROFILER anywhere that might be called within the scope of another API_PROFILER marker, using the same identifier. If you do, you’ll end up counting the time spent inside the target module twice! If absolutely necessary, you could modify the profiling module to circumvent this limitation, at the cost of a little extra overhead.
The destructor sometimes calls a function named Flush. It’s a heavier function, so we define it in a separate .cpp file, and make sure it’s only called once per second:
#if ENABLE_API_PROFILER

static const float APIProfiler_ReportIntervalSecs = 1.0f;

float APIProfiler::s_ooFrequency = 0;
INT64 APIProfiler::s_reportInterval = 0;

//------------------------------------------------------------------
// Flush is called at the rate determined by APIProfiler_ReportIntervalSecs
//------------------------------------------------------------------
void APIProfiler::Flush(INT64 end)
{
    // Auto-initialize globals based on timer frequency:
    if (s_reportInterval == 0)
    {
        LARGE_INTEGER freq;
        QueryPerformanceFrequency(&freq);
        s_ooFrequency = 1.0f / freq.QuadPart;
        MemoryBarrier();
        s_reportInterval = (INT64) (freq.QuadPart * APIProfiler_ReportIntervalSecs);
    }

    // Avoid garbage timing on first call by initializing a new interval:
    if (m_threadInfo->lastReportTime == 0)
    {
        m_threadInfo->lastReportTime = m_start;
        return;
    }

    // Enough time has elapsed. Print statistics to console:
    float interval = (end - m_threadInfo->lastReportTime) * s_ooFrequency;
    float measured = m_threadInfo->accumulator * s_ooFrequency;
    printf("TID 0x%x time spent in \"%s\": %.0f/%.0f ms %.1f%% %dx\n",
        GetCurrentThreadId(),
        m_threadInfo->name,
        measured * 1000,
        interval * 1000,
        100.f * measured / interval,
        m_threadInfo->hitCount);

    // Reset statistics and begin next timing interval:
    m_threadInfo->lastReportTime = end;
    m_threadInfo->accumulator = 0;
    m_threadInfo->hitCount = 0;
}

#endif
In the above code, printf is used for logging, but you could easily replace it with calls to sprintf and OutputDebugString, or anything else. The nice thing about logging to a console is that it works even when there is no graphical display, such as during the loading screen of a game, or when the application is starting up. Those are moments when you might be particularly interested in profiling a specific API.
Another convenient thing about this profiling module is that no explicit initialization is required. The very first time the macro is hit, it will call Flush. The first thread to enter Flush will see that s_reportInterval is not yet initialized, and will initialize itself. It doesn’t matter if two threads end up trying to initialize the globals at the same time; they will both write the same result.
I measured the overhead introduced by the API_PROFILER macro on two processors: 99 ns on a 1.86 GHz Core 2 Duo, and 30.8 ns on a 2.66 GHz Xeon. That’s just a little slower than an uncontended Windows Critical Section, making this a pretty good technique for fine-grained profiling. You could reduce the overhead further by calling __rdtsc instead of QueryPerformanceCounter, but the resulting numbers would be less reliable on multicore systems, so I chose not to mess with that.
Built-in profiling modules are nothing new – Jeff Everett describes another in-game profiler in Game Programming Gems 2. Hopefully, I’ve at least presented a few twists on the idea. I’d be interested to hear about any twists of your own. As far as I know, no third-party profiler is capable of profiling a multithreaded API as easily & accurately as the method I’ve described here – whether it’s Valgrind, xperf, VTune, Shark, PIX, Tuner, Visual Studio Profiler, or any other. Readers, correct me if I’m wrong!
Such profilers can, on the other hand, show you when a particular module becomes heavy – the module’s internal functions will appear near the top of PC sampling summaries, for example. Sometimes, even random breaking offers a similar clue. At that point, you might be compelled to use a built-in profiling module like this one, to drill deeper and to measure the impact of subsequent code changes.