 Preshing on Programming
Throughout the 80’s and 90’s, CPUs were able to run virtually any kind of software twice as fast every 18-20 months. The rate of change was incredible. Your 486SX-16 was almost obsolete by the time you got it through the door. But eventually, at some point in the mid-2000’s, progress slowed down considerably for single-threaded software – which was most software.
Perhaps the turning point came in May 2004, when Intel canceled its latest single-core development effort to focus on multicore designs. Later that year, Herb Sutter wrote his now-famous article, The Free Lunch Is Over. Not all software will run remarkably faster year-over-year anymore, he warned us. Concurrent software would continue its meteoric rise, but single-threaded software was about to get left in the dust.
So, what’s happened since 2004? Clearly, multicore computing has become mainstream. Everybody acknowledges that single-threaded CPU performance no longer increases as quickly as it previously did – but at what rate is it actually increasing?
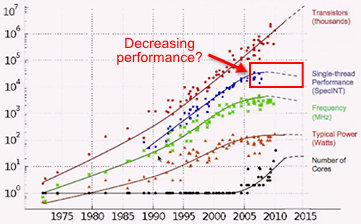
It’s tough to find an answer. Bill Dally of nVidia threw out a few numbers in a recent presentation: He had predicted 19% per year, but says it’s turned out closer to 5%. Last year, Chuck Moore of AMD presented this graph, suggesting that single-threaded CPU performance recently started going backwards:
These figures aren’t really consistent, and both struck me as a little low. Moreover, I couldn’t find another source to corroborate them. So I decided to crunch the numbers myself. I turned to SPEC, an industry-standard benchmark that’s been going strong since 1989. It’s the same benchmark used to plot a few data points on the above graph.
SPEC licenses their benchmarking software to various companies, collects results back from those licensees, and makes those results available on their website. One of their benchmark series, SPECint, was designed to measure the single-threaded integer performance of a machine. That sounds perfect, except for one catch: many licensees use automatic parallelization. I took some pains to remove those results from the dataset. I’ll share the method at the end of this post, and you can let me know if you think it’s valid.
I fetched SPEC’s data on Feb. 7, grouped the results by CPU brand, and generated the following graph. It consists of 5052 test results from 715 different CPU models, all gathered over the last 17 years:
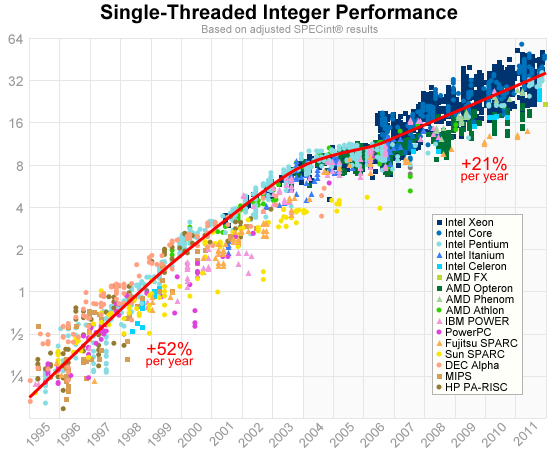
Each test result is plotted according its hardware availability date, and the vertical axis uses a logarithmic scale. The graph incorporates results from three different benchmark suites (CPU95, CPU2000 and CPU2006), but I’ve normalized the results in order to see historic trends.
The red line is meant to represent mainstream CPU performance. I drew it manually, using the less-than-scientific method of eyeballing the points for Pentium, PowerPC, Athlon and Core. If you’re willing to trust this line, it seems that in the eight years since January 2004, mainstream performance has increased by a factor of about 4.6x, which works out to 21% per year. Compare that to the 28x increase between 1996 and 2004! Things have really slowed down.
Here are a few machines located along the red line in the graph:
| Hardware Availability | Adjusted Result | CPU Model | Clock Rate | CPU Cache |
|---|---|---|---|---|
| Feb 2004 | 8.1 | Intel Pentium 4 | 3200 MHz | 28KB L1, 1MB L2 |
| Jun 2005 | 10.5 | AMD Athlon 64 FX-57 | 2800 MHz | 128KB L1, 1MB L2 |
| Jul 2006 | 11.4 | Intel Core 2 Duo E6300 | 1867 MHz | 64KB L1, 2MB L2 |
| Jul 2007 | 13.3 | Intel Core 2 Duo T7700 | 2400 MHz | 64KB L1, 4MB L2 |
| Sep 2008 | 17.9 | Intel Core 2 Duo T9600 | 2800 MHz | 64KB L1, 6MB L2 |
| May 2009 | 21.8 | Intel Core 2 Duo E7600 | 3066 MHz | 64KB L1, 3MB L2 |
| Jul 2010 | 24.3 | Intel Core i3-540 | 3067 MHz | 64KB L1, 256KB L2, 4MB L3 |
| Jun 2011 | 31.7 | Intel Pentium G850 | 2900 MHz | 64KB L1, 256KB L2, 3MB L3 |
As you can see, Intel deserves credit for squeezing out the most single-threaded performance since 2004. If you remove all Intel CPUs from the data, a different picture emerges:
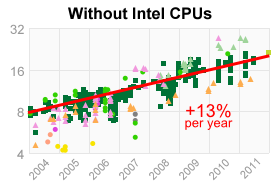
This is not too surprising, as AMD is pretty open about their stance on single-threaded performance. Bulldozer, their latest microarchitecture, is meant to shine in multithreaded workloads.
So far we’ve only looked at integer performance. SPEC also publishes SPECfp, an equivalent benchmark for floating-point performance. Floating-point performance has always been important for heavy-duty computation such as scientific simulation or 3D rendering. Here are the results, which I’ve also adjusted to eliminate autoparallelization:
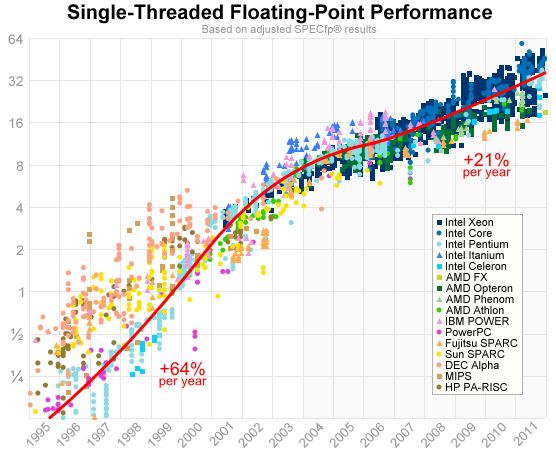
Prior to 2004, it climbed even faster than integer performance, at 64% per year: a doubling period of 73 weeks. After that, it leveled off at the same 21% per year.
Up until 2002, we see a huge difference in floating-point performance between mainstream and workstation CPUs. The Alpha, SPARC and MIPS all ran up to 8x faster. Of course, you had to pay $10000 or more to get your hands on such a workstation. This is an interesting reminder that CPUs are, in fact, things created by businesses to make money! They don’t become faster entirely by technological forces. They become faster by economic forces.
Which brings us back to the present day. For reasons which others understand better than me, involving thermal design power and ILP, it’s now more cost-effective for manufacturers to pack additional cores onto a die than to push the single-threaded performance envelope much further.
Given the significance of this shift away from single-threaded performance, I was surprised to not find more information about the actual trajectory of performance since 2004. At the same time, I can’t guarantee that the data I’ve presented perfectly reflects single-threaded CPU performance. I think my conclusions are fair, but any feedback or criticism about the approach is more than welcome.
How These Graphs Were Generated
All Python scripts are available on GitHub. These scripts will download, analyze and adjust SPEC’s data, and render the graphs. If you’d like to run them yourself, see the README file for exact instructions.
As already mentioned, recent compilers like Intel C++ and IBM XL feature automatic parallelization, and it greatly skews the results towards certain benchmarks. For example, check out the performance of 462.libquantum in this result! SPEC permits the use of autoparallelization as long as it’s clearly indicated. Unfortunately, this compiler feature is so widely enabled, I couldn’t simply exclude all such results. If I had done so, I would be left with zero results for Intel’s Core i3, i5 and i7 processor families.
The compromise I chose was to identify the top six benchmarks which seem to benefit from automatic parallelization, disqualify those benchmarks from the test suite, and take the geometric mean of the remaining ones. This approach assumes that automatic parallelization does not work on every benchmark. For the list of disqualified benchmarks, and the algorithm which identifies them, check the GitHub files.
In the end, you’ll find that even if you leave the disqualified benchmarks in the results, it doesn’t significantly change the conclusions in this post. It shifts most of the CPU2006 results upwards – up to 25% – which simultaneously shifts the conversion ratios from CPU95 and CPU2000 upwards, keeping everything roughly in line.
In the future, it would be interesting for licensees to submit more results without automatic parallelization. That would help us more easily observe the performance trend of single CPU cores.
[Update: HenkPoley has posted an update of these graphs for February 2014.]