 Preshing on Programming
Sometimes, a series of random breaks into the debugger can help identify bottlenecks in your code. The more running time taken by a function, the greater the probability it will appear on the callstack. If the same function shows up five out of ten times, your application is likely spending 50% of its time inside it. This rudimentary technique is kind of like PC sampling with stack walking, but with an extremely low sampling rate. Therefore, it works best when there is a really significant bottleneck to find. The nice thing about it is that no special profiling tools are required – just the debugger.
I used this trick while developing a small test program for an earlier post, Hash Table Performance Tests. The goal was to find and eliminate any hidden bottleneck which could skew the results. First, I discovered that the Windows heap is slow when launched from the debugger. After that, I found two other bottlenecks using the same technique. Both were fairly obvious, so this post won’t exactly break any new ground, but I thought I’d share them here as part of a series about Visual C++ Performance Pitfalls.
DLL Runtime Overhead
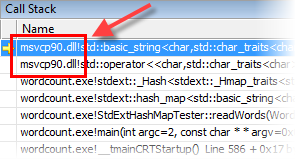
A quick series of random breaks showed that the process was often spending time inside msvcp90.dll, the DLL Runtime for the standard C++ library, executing C++ library functions.
This reminded me that the application was built using the DLL Runtime in the first place. By default, every new Visual C++ project uses the DLL Runtime (/MD) in Release, as you can see in my previous post. This setting is safer for multi-DLL applications, but it’s well-known that the DLL calling convention adds some overhead. So the next step was to switch to the static runtime (/MT) and measure the difference in performance.
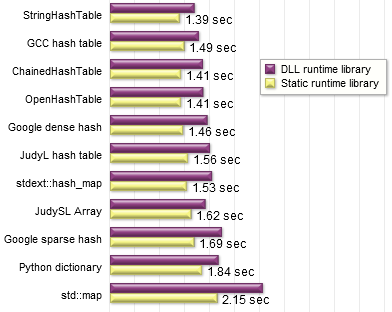
The resulting time savings varied between 15 - 30%. Each container improved by a different amount. For example, the timing for the JudySL array improved by a smaller percentage than std::map. I suppose the JudySL test simply makes fewer calls to the standard library in total, thereby crossing the DLL boundary fewer times, resulting in a smaller performance penalty.
I decided to stick with static linking, to keep all the container tests on a level playing field, and measure each one at its best.
Repeated calls to std::istream::get
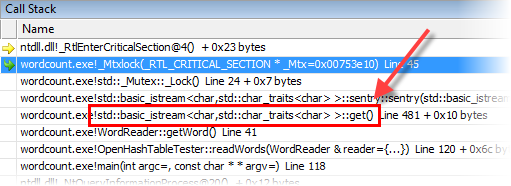
The next time breaking randomly, I found that the process was spending most of its time inside std::istream::get, just reading the next character from the input file. Although some code is inlined, the get call still needs to wind its way through several function layers and attempts a mutex lock for each character. This was undesirable, since the whole point of this application was to measure the performance of hash tables and related containers – not the performance of istream.
The main loop identifies words by reading one character at a time. In the code snippet below, the member variable m_inFile has type std::ifstream &. Here’s the call to istream::get:
const char *getWord()
{
    int wordLen = 0;
    for (;;)
    {
        char c = m_inFile.get();
        if (m_inFile.eof())
            break;
        int lower = c | 0x20;    // lowercase
        if (lower >= 'a' ? lower <= 'z' : (lower >= '0' && lower <= '9'))
        {
            ...
Given that there was so much overhead here, I decided to preload the entire document (about 10 MB) and read each character directly from memory. The call to std::istream::get turns into a pointer lookup and increment:
const char *getWord()
{
    int wordLen = 0;
    while (m_rdPos < m_endPos)
    {
        char c = *m_rdPos++;
        int lower = c | 0x20;    // lowercase
        if (lower >= 'a' ? lower <= 'z' : (lower >= '0' && lower <= '9'))
        {
            ...
After this change, running times decreased significantly.
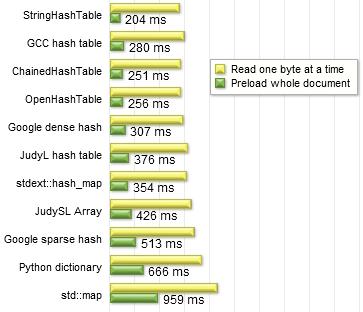
In fact, the running time decreased by the same amount for each container – roughly 1.2 seconds. This makes sense, since the same overhead was eliminated in each case – about 10 million calls to std::istream::get.
In applications which need better I/O performance, the best strategy usually involves reading the input stream in chunks of say, 64 KB, and accessing memory directly within each chunk. Browsing the std::stream source code, I get the feeling that’s actually what its authors intended. But as you can see, it doesn’t really turn out that way in Visual C++ 2008. I wonder if eliminating the mutex would reduce most of the bottleneck, but there’s no way to find out. Microsoft eliminated the single-threaded Runtime Library in Visual C++ 2005. They offer some tips to improve the performance of the multithreaded runtime, but those tips only work for the C runtime library, not C++.
In any case, the next time you suspect a big bottleneck in your own code, you might want to try a few random breaks and see if any pattern emerges. A colleague recently used this trick during production, and managed reduce editor loading times by more than 50%. I don’t claim this technique is splitting the atom, but it is sometimes surprising how long a project will live with a bottleneck that can be found using a few random breaks.
Update: This answer on Stack Overflow recommends the exact same technique, and presents some math to support the argument that it’s reliable. Judging from the number of upvotes, it seems some people agree.
As for my little word-counting application, that was the last big bottleneck found via breaking. Some tuning opportunities still remained, but those involved poking through the disassembly and tweaking project settings. I’ll cover that in the next few posts.