 Preshing on Programming
For my Hash Table Performance Tests post, I wrote a Windows application which runs a word-counting algorithm using various types of containers. It was originally built using default Release settings in Visual C++ 2008. At first, it ran very slowly, but after some tuning, it ran much faster. You can see the difference in performance in my previous post, Visual C++ Performance Pitfalls.
The first thing I noticed was that the program ran more slowly when launched from the debugger versus running it from the command line:
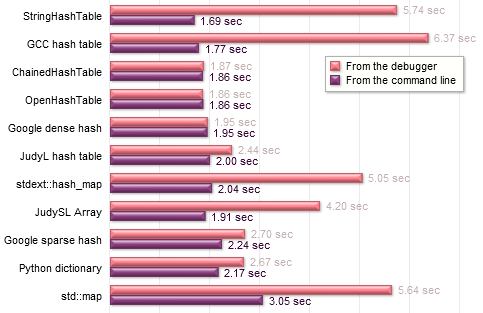
Both timings were taken using the exact same executable. No settings were changed; even the input data was the same. The only difference was the debugger. This is not normal – the presence of a debugger shouldn’t impact performance to this extent, unless the process is directly interacting with the debugger in some way. That was not the case for my test suite – or so I thought!
The first step of investigation was just to break randomly a few times. When you break randomly into the debugger, the functions which hog the most CPU time are likely to appear often in the callstack. Using this approach, I found that the process was usually busy allocating memory on the heap. At those moments, a function named RtlDebugAllocateHeap also appeared on the stack:
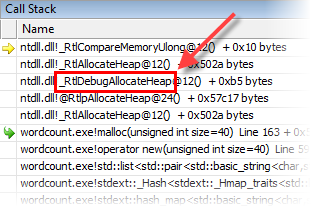
It was rather suspicious to see a function with “Debug” in its name. This was supposed to be a Release build! I googled the function name, which eventually led to this page on MSDN:
Processes that the debugger creates (also known as spawned processes) behave slightly differently than processes that the debugger does not create. Instead of using the standard heap API, processes that the debugger creates use a special debug heap.
This certainly explains the numbers in the above table. Notice in particular that the more memory allocations each container performs, the more slowly it runs in the debugger. ChainedHashTable, OpenHashTable and Google dense hash perform relatively few allocations, so it makes less difference for them. (Those containers allocate big arrays, and the VC++ implementation of std::string does not allocate extra heap memory for strings of fewer than 16 characters.)
So in other words, yes, the process was interacting with the debugger in some way. Not through any code in the application itself, but through ntdll.dll, a system DLL. This DLL secretly checks whether the process was launched from the debugger, and if so, enables special debug options on the system heap.
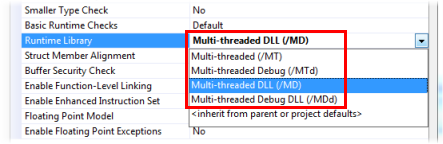
It has nothing to do with your project settings
In Visual C++, you can choose between several configurations of the C/C++ Runtime Library (CRT): Multi-threaded, Debug, DLL or Debug DLL. This has nothing to do with the issue! It doesn’t matter what you choose here; you will still get different heap performance in the debugger versus outside the debugger.
If you search the web, you’ll find a fair number of people who confuse the CRT debug heap (which is enabled when you select a Debug version of the Runtime Library) with the system debug heap. Keep in mind that the CRT debug heap is a build-time setting, whereas the system debug heap is a runtime setting.
 Windows provides a heap implementation at the system level. You can create as many system heaps as you want, using the
 HeapCreate function, and allocate memory from them using HeapAlloc. These functions are really just thin wrappers around RtlCreateHeap and RtlAllocateHeap, from ntdll.dll, the sneaky DLL mentioned earlier.
The C Runtime Library defines its own set of heap functions: malloc and friends. In Visual C++, these functions are just wrappers around a single system heap, created using HeapCreate. (See heapinit.c in the CRT source code.) Any call you make to malloc gets translated into a call to HeapAlloc. Sure, when you use the CRT debug heap, malloc will perform some extra housekeeping and consistency checks, but it still calls HeapAlloc to do the real work. Furthermore, in C++, the preferred way to manipulate the heap is to invoke the new operator – this, in turn, is (by default) just a wrapper around malloc.
Therefore, no matter if you call malloc, new or HeapAlloc, and no matter which version of the CRT you use, all of these calls end up using a system heap inside ntdll.dll – and they will all run more slowly if the process was launched from the debugger.
How to disable it
The easiest way to disable the debug system heap is to simply launch the process outside the debugger.
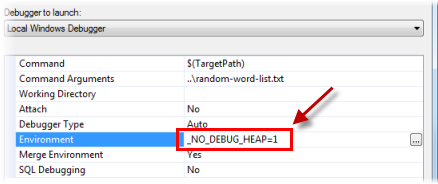
If that’s not an option, then as the MSDN documentation says, you can disable it by setting the environment variable _NO_DEBUG_HEAP to 1. You can set it at the system level: Control Panel → System → Advanced system settings → Environment Variables. This will affect every application you debug. Otherwise, you can specify it on a per-application basis, using the debugger setting shown below. Be aware that this setting is saved in a user-specific options file, and not in the project file (.vcproj or .vcxproj).
The documentation also says you can specify -hd on the debugger command line, but that option only applies to WinDbg, not Visual Studio.
You could also bypass the Windows and CRT heaps completely, and use an alternative heap implementation in your application, such as DLMalloc. Obviously, this is a bit more complicated. I’m not sure it’s popular thing to do in Visual C++, outside the video game industry.
In summary, this is a pretty nasty bottleneck. It could affect any program, it’s non-obvious, and the performance penalty can be steep. Not only that, but the fact that a debugged process behaves differently can lead to heisenbugs. So it’s good to be aware of its existence.
In my next post, Finding Bottlenecks by Random Breaking, I’ll show a couple of other pitfalls I encountered while gathering benchmarks for the Hash Table Performance Tests.
Update: Tom Gaulton has written about this same subject in his #AltDevBlogADay post, The unexpected performance of debug builds.